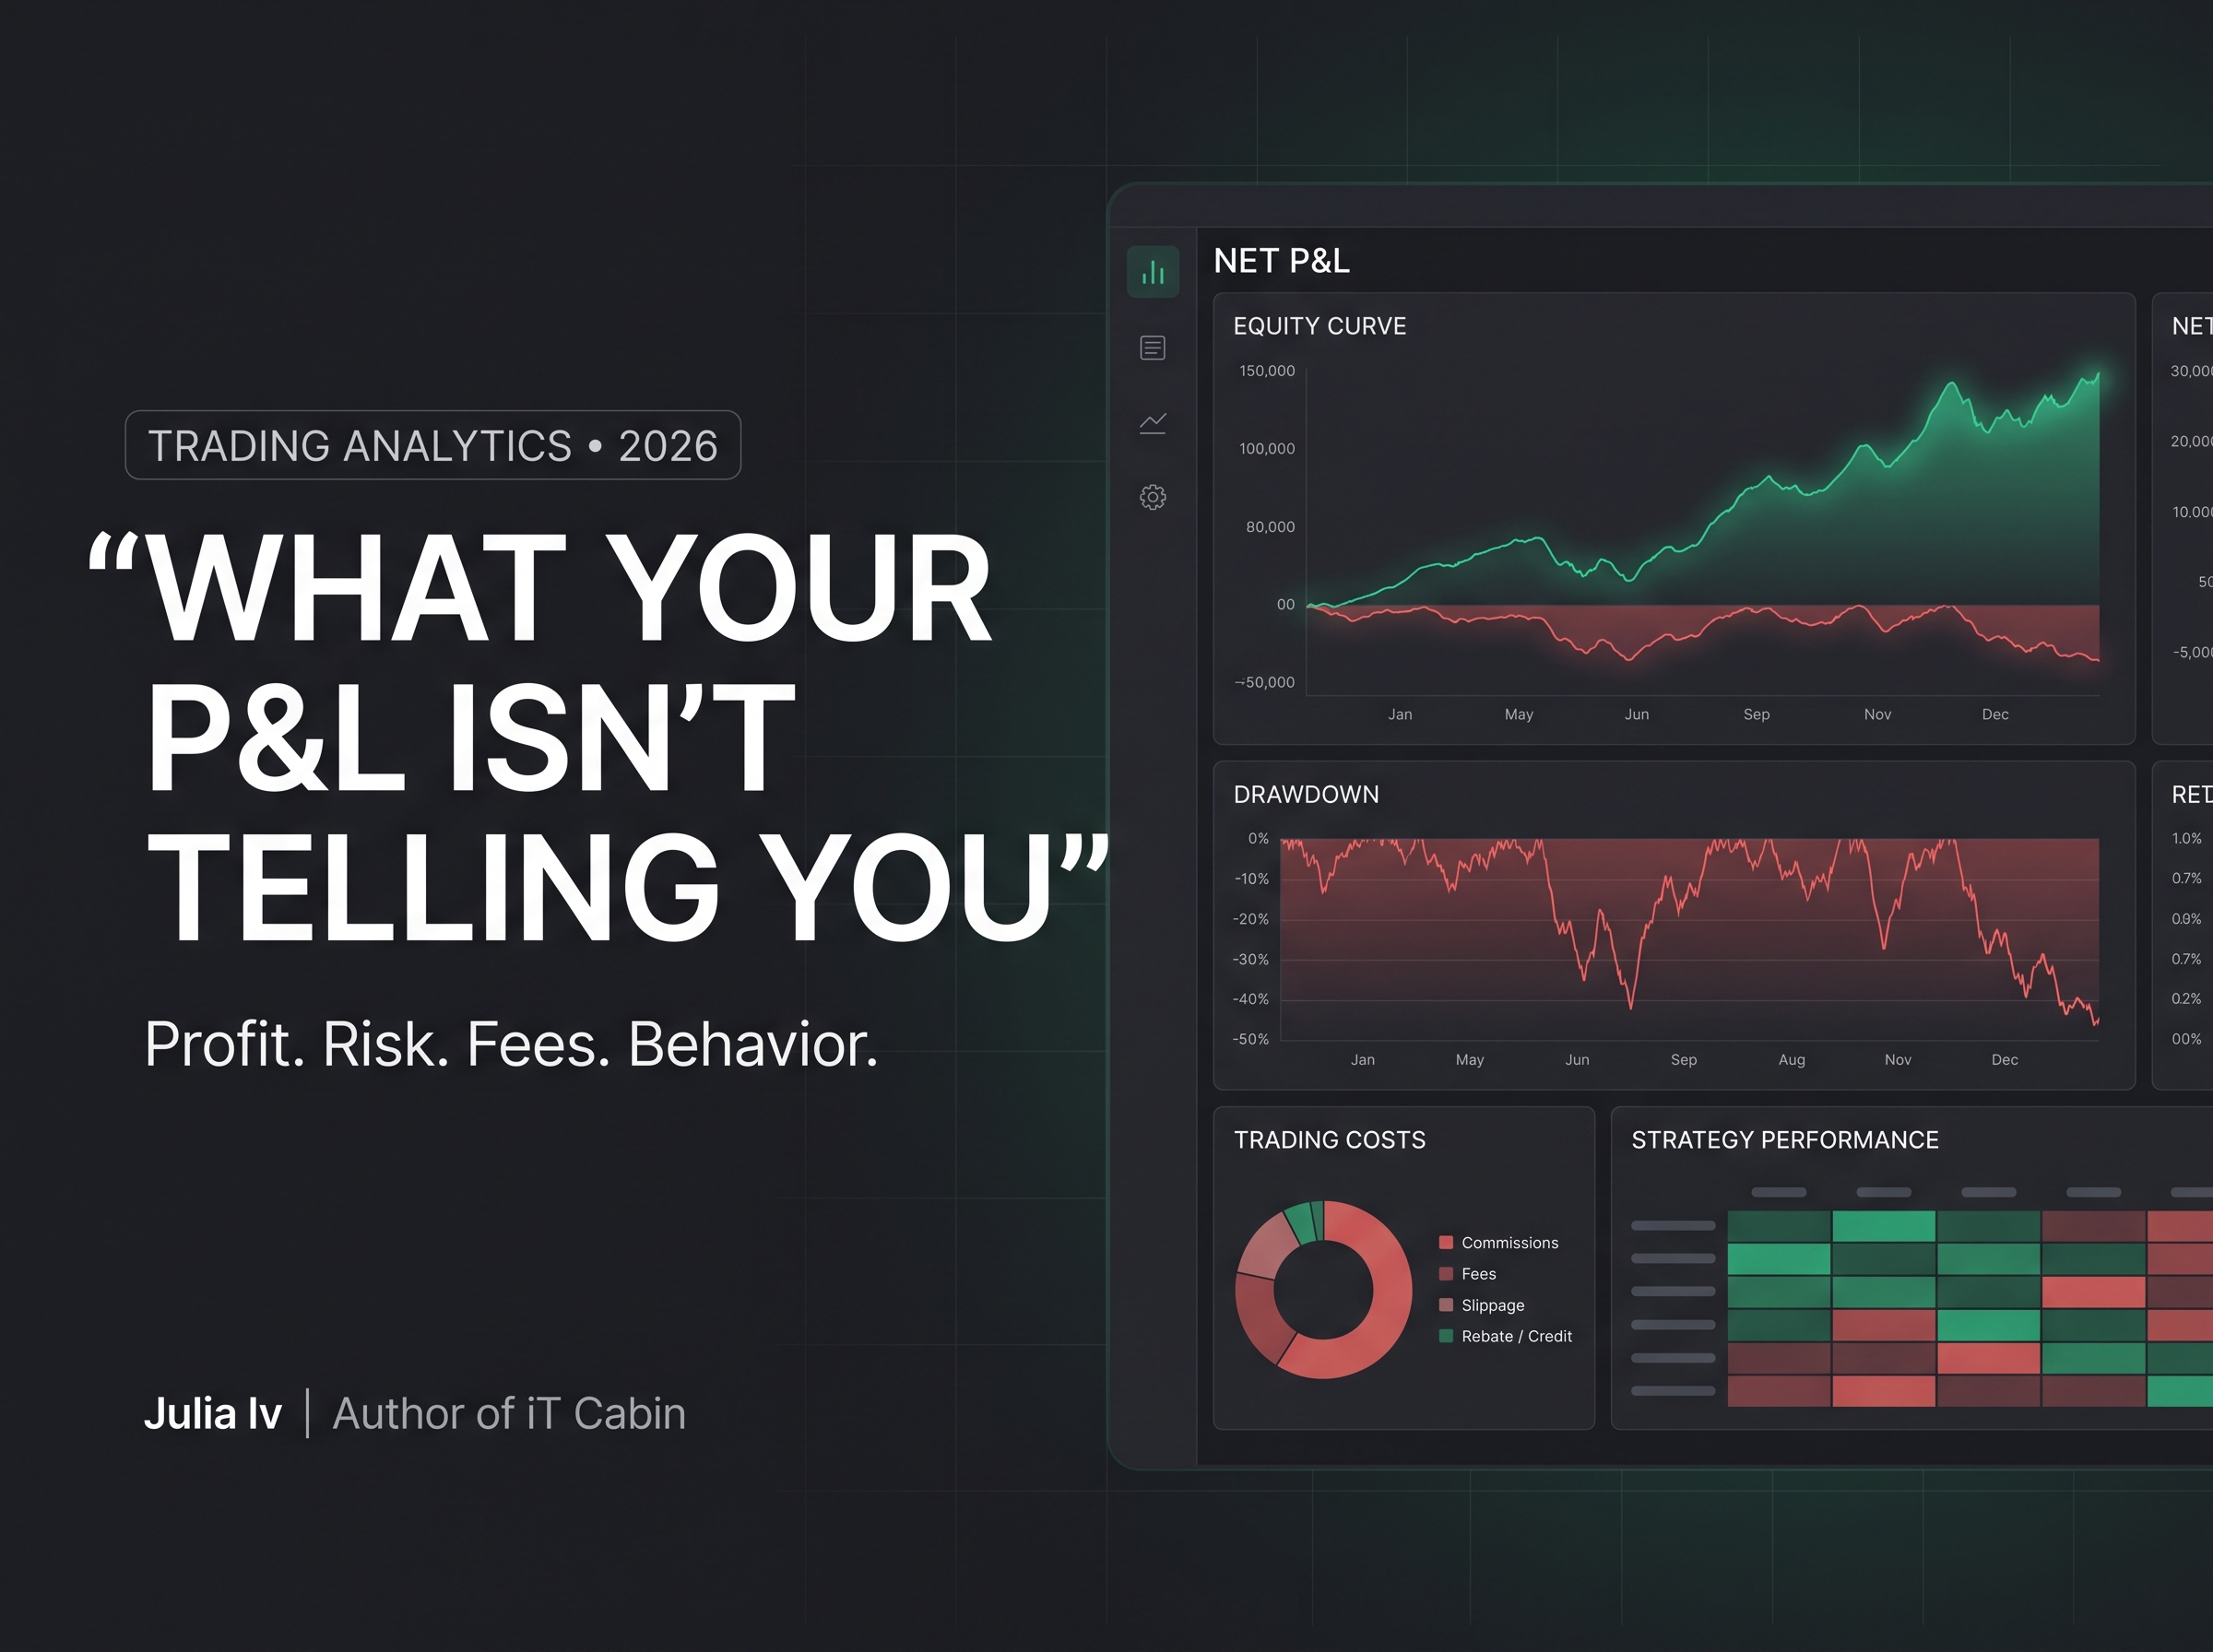
“As AI makes trading analysis faster, the ability to question the numbers becomes more valuable.”
— Julia Iv, author of *iT Cabin
A green trading day can hide an expensive habit.
You can finish profitable because one oversized position rescued five poor entries. You can win most of your trades and still lose money. You can run a strategy that looks impressive until commissions, financing costs, and a difficult market regime enter the picture.
A P&L number cannot explain those differences on its own.
That is the useful direction emerging in trading analytics in 2026: connecting results to execution, risk, market conditions, and the decisions that produced them. Recent product releases show vendors moving toward automated review and more detailed diagnostics. They do not establish that buying an analytics platform improves returns.
For active U.S. traders, the practical question is straightforward: can your dashboard explain how you made money, how you lost it, and whether the process deserves to be repeated?
What is actually changing in 2026?
On May 26, TradeZella announced Zella AI, describing conversational analysis and background agents that review trades, tag behavior, and surface patterns using a trader’s recorded data. The company explicitly distinguishes the product from an execution bot: it does not place trades.
TradesViz’s August 29 changelog documents a related direction. Its 2026 releases include AI-assisted review backed by deterministic checks, exit diagnostics, expanded account syncing, open-position analysis, and options backtesting. These are vendor-reported capabilities, not independent evidence of better trading performance.
Together, these releases illustrate three connected developments: less manual journal administration, more attention to execution and behavior, and closer connections between historical review and current exposure. That is an interpretation of the releases, not a market-wide adoption estimate.
An AI summary can make analysis easier to consume. The underlying calculations still have to be correct.
P&L: start with the money you actually keep
A useful dashboard separates realized P&L, unrealized P&L, explicit trading costs, and external cash flows.
Depositing $5,000 is not a $5,000 trading gain. A profitable closed position does not cancel the risk in an open loser. A gross trading result does not tell you what remains after costs.
For closed trades, a practical starting point is:
Net trading P&L = P&L calculated from actual fills − explicit trading costs not already included.
Those costs can include commissions, exchange and regulatory fees, and applicable borrowing or financing charges. Software and data subscriptions belong in a separate view of the trading operation’s overall profitability.
Spread and slippage require careful treatment. Their economic effect is already reflected in actual execution prices. Estimate them against a defined benchmark to evaluate execution quality; do not subtract them again from fill-based P&L.
A useful dashboard makes its accounting visible enough for the trader to reconcile it with broker records.
Win rate: a satisfying number that can mislead
Consider a hypothetical strategy with 100 closed trades:
| Metric | Result |
|---|---:|
| Winning trades | 70 |
| Losing trades | 30 |
| Average winner before explicit fees | $100 |
| Average loser before explicit fees | $250 |
| Gross profit from winners | $7,000 |
| Gross loss from losers | $7,500 |
| P&L before explicit fees | −$500 |
| Explicit fees across all trades | $300 |
| Net P&L | −$800 |
The win rate is 70%. The account still loses money.
Average net P&L per trade sample expectancy is negative $8. That number describes this sample; it does not promise the same result in the next 100 trades.
Win rate becomes useful when displayed beside average win, average loss, expectancy, profit factor, and sample size. Profit factor divides total winning P&L by the absolute value of total losing P&L, using a clearly stated gross or net convention.
The dashboard should also explain what counts as one trade. Partial exits and multi-leg options positions can distort the story when one platform counts executions and another counts complete positions.
Drawdown: measure the path, not just the endpoint
Two strategies can produce the same net profit while exposing an account to very different experiences.
Drawdown measures the decline from a previous equity peak. Maximum drawdown records the largest such decline within the observed period. It is a historical measurement, not a ceiling on future losses.
For active trading, the useful view includes current drawdown, maximum drawdown, time below the previous peak, and recovery duration.
Measurement frequency matters. An end-of-day equity curve can hide a deep intraday loss. A curve based only on closed trades can hide unrealized losses. Deposits and withdrawals can also distort the calculation unless the methodology handles cash flows explicitly.
For funded accounts, display the applicable account rule separately from ordinary portfolio drawdown. A trailing threshold, a fixed threshold, and a daily loss limit answer different questions. The dashboard must match the firm’s actual definitions, including when thresholds reset and whether unrealized P&L counts.
Commissions: make the cost of activity visible
Imagine a hypothetical month with $2,400 in trading P&L before explicit costs and $1,650 in commissions and other direct trading charges. The remaining $750 tells a different story from the headline result.
Useful cost views include dollars paid, cost per completed trade, cost by strategy, and costs relative to turnover or positive pre-cost profit. Percentage ratios become misleading when their denominator is near zero or negative.
The key comparison is marginal: did additional trading generate enough additional profit to cover its additional cost?
A trader may discover that the first few qualifying setups produce most of the result, while later trades add activity and expense. That is a hypothesis to investigate across comparable sessions, not a reason to impose an arbitrary daily trade limit.
Mistakes: separate process from outcome
A losing trade can follow the plan perfectly. A winning trade can violate every risk rule.
Behavioral analytics should preserve that distinction.
Record specific actions: exceeding planned size, entering outside a defined setup, widening a stop, trading during a prohibited window, or continuing after a stated loss limit.
Then compare rule-compliant and noncompliant trades while accounting for position size, strategy, and market conditions. Show the number of observations. Label P&L associated with violations accurately; it is not automatically money that would have been saved by removing them.
An AI system may flag possible revenge trading from trade timing and size. It cannot reliably infer the trader’s emotional state from fills alone. Notes and human review supply context the transaction log does not contain.
Volatility: ask when a strategy works
A blended performance number can conceal a strategy that behaves differently across market conditions.
Break results down by conditions defined before evaluating the outcome: realized volatility, implied volatility where relevant, liquidity, time of day, event exposure, and trend or range behavior.
Avoid defining a “trending day” using information that would not have been available at entry and then presenting it as a live trading filter.
For U.S. options traders, this context is especially relevant. In its July 21 report, Cboe said second-quarter 2026 options average daily volume reached 72.8 million contracts, more than 19% above the year-earlier period. It also reported continued growth in same-day expirations.
Those figures describe market activity, not trader profitability. The practical implication is that an options dashboard should preserve expiration, entry time, position structure, and relevant volatility exposure. A single options win rate can obscure fundamentally different risks.
Strategy effectiveness: find what survives scrutiny
Organize analytics around defined setups and strategy versions.
A strategy-level view should bring together net expectancy, drawdown, cost, holding period, exposure, and profit concentration. If a few exceptional trades account for nearly all profits, that fact belongs beside the average.
Maximum favorable excursion and maximum adverse excursion help examine how far a position moved in the trader’s favor or against it while open. They can support exit analysis, but the best historical price was not necessarily an executable exit.
Keep backtests, paper trades, and live results separate. A simulated fill is an assumption. A live fill is an observation.
Every additional filter also creates another opportunity to discover a pattern by chance. A setup that looks excellent in twelve carefully selected trades needs more evidence. Use unseen periods, realistic costs, and forward observation before treating a finding as a durable edge.
AI analysis needs a visible audit trail
The most useful AI answer is one a trader can inspect.
If a system says afternoon entries underperform, it should show the date range, included trades, sample size, exclusions, cost treatment, and comparison method. The trader should be able to reproduce the result without trusting the wording.
Data quality sits underneath that entire workflow. In its July 2026 industry commentary, updated in August, TradesViz highlights maintenance problems involving broker formats, partial fills, corporate actions, and options assignments. It is a vendor’s perspective, but the operational issues it identifies are relevant when evaluating an analytics product.
For a dashboard, that means exposing failed imports, duplicate records, missing fees, stale positions, and the last successful sync.
Freshness also matters. TradesViz describes its Plaid connection as periodic journal syncing, not real-time execution streaming. A historical review tool should not be mistaken for a live risk control.
What belongs on the first screen?
A practical dashboard can start with a small set of connected views:
| View | Question it should answer |
|---|---|
| Net P&L and open exposure | What have I earned, and what remains at risk? |
| Drawdown and recovery | How difficult has the path been? |
| Win rate, payoff, and expectancy | Do winning trades compensate for losing ones? |
| Costs | How much does my activity consume? |
| Strategy and regime breakdown | Where are results coming from? |
| Rule adherence | Am I following the process I intended? |
| Data quality and freshness | Can I trust this picture? |
Each summary should lead to the underlying trades. Account, strategy, date, and session filters should apply consistently across the page.
For builders, the commercial opportunity is to make that investigation reliable and repeatable. Accurate imports, understandable calculations, useful comparisons, and traceable findings give traders reasons to return.
In 2026, AI can make the review faster. The dashboard earns its place when a trader can follow a result back to the evidence and decide what deserves to change.